
About me
Data Scientist with a background in Nursing and Business Informatics.5+ years working with real-world data across health, public policy, and research.Python · R · SQL · ShinyOpen to data analyst and data scientist roles in Germany — remote or Kiel/Hamburg area.
Projects
Python · XGBoost · LightGBM · SHAP · NLP
ML Pipeline for Emergency Triage Acuity Prediction
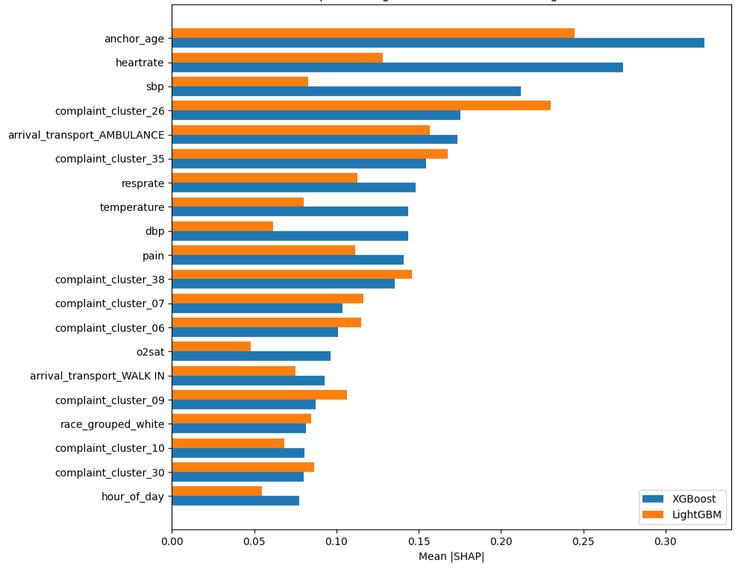
TriageGeist is an ML pipeline for predicting emergency department patient acuity (ESI 1–5) using the MIMIC-IV ED dataset.Structured triage data — vital signs, demographics, and arrival information — is combined with NLP-encoded chief complaints via Bio_ClinicalBERT and 40-cluster KMeans semantic grouping.A subject-wise GroupShuffleSplit prevents patient-level data leakage across train/test sets.XGBoost and LightGBM baselines were trained with an asymmetric clinical cost matrix to penalize under-triage. The soft-voting ensemble achieves QWK ~0.53–0.56 on validation.SHAP analysis reveals complementary signal: XGBoost relies more on vitals, LightGBM on complaint clusters.
Python, Pandas, Matplotlib, R, Shiny
Maternal Mortality
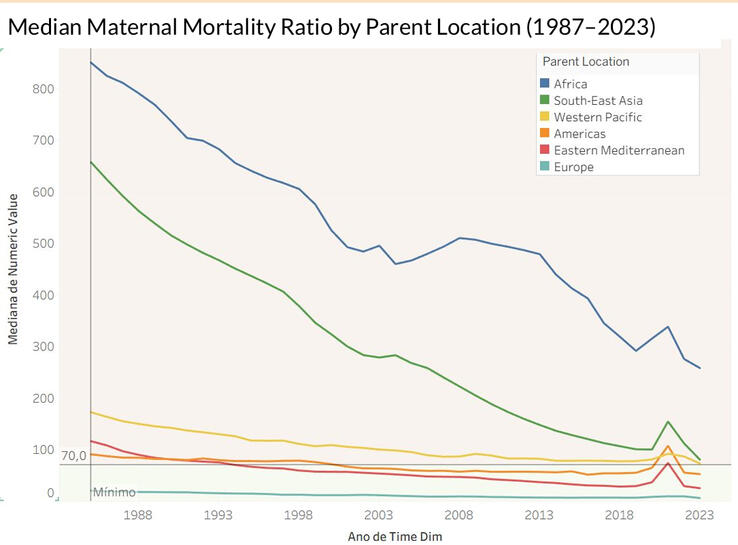
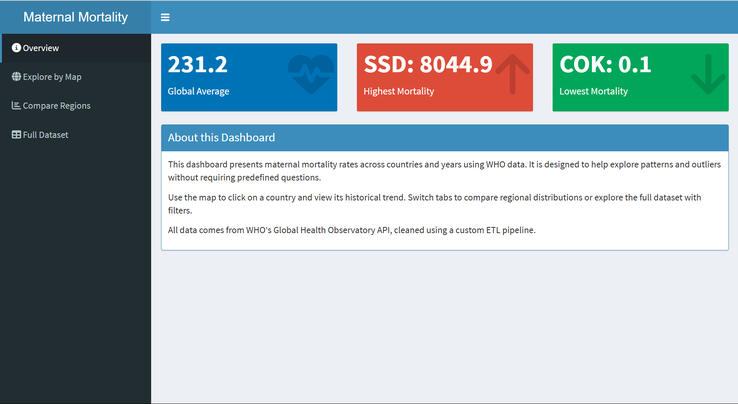
Cleaned and analyzed over 30 years of data from the World Health Organization to identify regional trends and patterns in maternal mortality.The project involved data wrangling, visual exploration, and the identification of high-risk areas based on structured indicators.The final dashboard allows users to explore mortality rates by country, year, and region.It includes interactive visualizations, comparison tools, and summary statistics, offering an accessible way to analyze global disparities and historical progress in maternal health.
R, ggplot2, cluster, sf
Substance-Related Incidents
Built an R-based data preparation pipeline for public emergency response records on substance use and naloxone administration. Standardized and integrated multi-source data, resolved duplicates, and exported a clean dataset ready for analysis and visualization.
R, Shiny, ggplot2, dplyr, K-means
Infant Mortality: Spatiotemporal Analysis
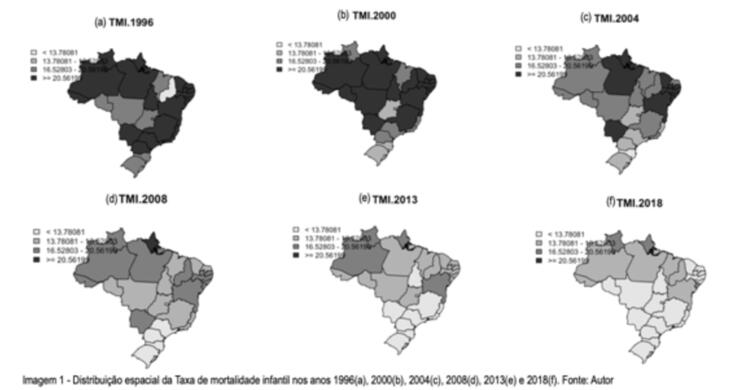
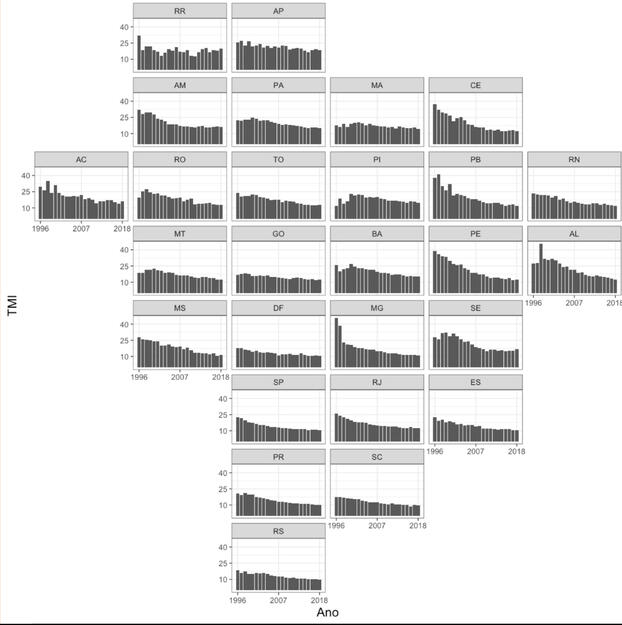
Analyzed 20 years of infant mortality data across Brazilian states using clustering and spatial statistics.Applied K-Means to identify regional patterns and Global Moran’s I to assess spatial autocorrelation.Created advanced visualizations to highlight disparities and temporal trends.
R, PCA, ggplot2, Hypothesis Tests
Population Aging – Spatial Analysis
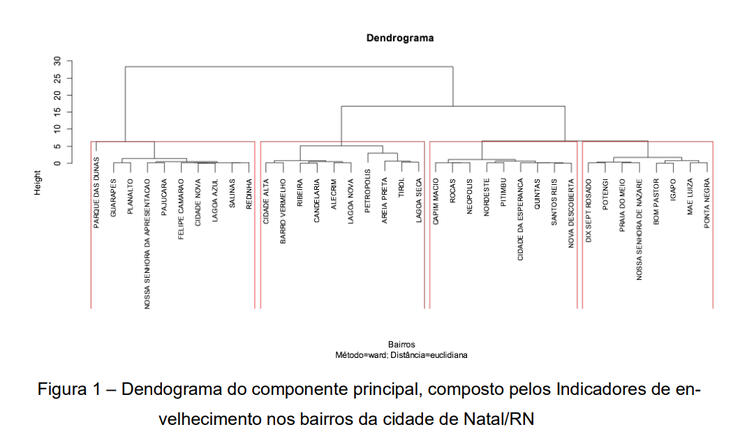
Created an aging index by neighborhood using principal component analysis (PCA) and socioeconomic indicators.Conducted hypothesis testing, built decision trees for neighborhood grouping, and visualized results through choropleth maps.Project supported local public health planning for elderly care.
© Giulia Sepeda. All rights reserved.